This disconnect should be sounding alarm bells to investors, and we believe it is, but perhaps not in the way you might think.
Essentially, the SA equity market is being driven up by a narrow set of stocks that were already expensive, and are getting more expensive. We can see this clearly if we look at the contributors to the ALSI return for 2013. Figure 1 shows the marginal contribution of the 20 stocks that most impacted on last year's performance. For example, it shows that SABMiller and Richemont alone contributed almost 7% of the 26.8% return. If you owned all the other shares in the market, but not these two, you would have earned a return of 20%.
It also shows that these 20 stocks contributed 22.4% of last year's total market performance, and a staggering 15.4% came from large cap industrials (highlighted in red). If you didn't own these 13 industrial stocks, but you owned the rest of the market, you would have only earned an 11.4% return last year, which while lower, makes more sense given the economic backdrop.
Most of the stocks that did well last year are, no doubt, extremely high quality firms but - and here's the issue - they are very expensive, high quality firms. Take a look the Cyclically Adjusted Price Earnings (CAPE) ratios of some of these popular stocks, shown in Table 1. Across different time frames and in various markets around the world, history has demonstrated consistently that anything above a CAPE ratio of 16x is expensive, and we believe anything above 19x is very expensive.
| Table 1: Valuations on the JSE using Cyclically Adjusted Price Earnings ratios | ||
|---|---|---|
| Company Name | CAPE Ratio (x) | Return (%, 2012) |
| Woolworths | 39.2 | 77.9 |
| Mr Price | 44.7 | 72.5 |
| Aspen | 40.6 | 70.5 |
| Imperial | 18.5 | 61.0 |
| Richemont | 33.2 | 56.0 |
| Naspers | 38.4 | 53.8 |
| Shoprite | 48.7 | 47.9 |
| Truworths | 36.4 | 47.2 |
| Bidvest | 17.4 | 39.2 |
| SABMiller | 30.5 | 34.8 |
| Remgro | 17.1 | 34.2 |
| MTN | 17.6 | 23.6 |
| Massmart | 29.0 | 9.4 |
While most of these stocks are decidedly expensive, it's easy to find reasons to own them. This is not unlike the situation in 2007 when investors and the market, enthused by the pre-Soccer World Cup construction frenzy, justified the outlandish multiples of construction stocks. In fact, those multiples and these are strikingly similar; see Table 2. But back in 2008, when the realization finally sunk in that the overpriced construction stocks simply could not grow earnings ad infinitum and would disappoint investors, the shares were severely punished, slumping by 40% for the year. This scenario is very repeatable today, but investors are pretending otherwise.
| Table 2: CAPE ratios for construction stocks in 2007 versus today | ||
|---|---|---|
| Stock Name | CAPE Ratio (x) 2007 | CAPE Ratio (x) 2013 |
| Aveng | 44.3 | 8.0 |
| Group Five | 38.9 | 7.8 |
| Murray & Roberts | 58.1 | 9.5 |
| WBHO | 53.6 | 11.8 |
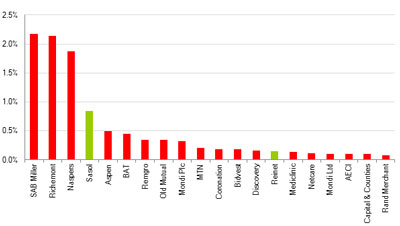
And things haven't changed much in 2013. Figure 2 shows the top 20 stocks' contributions to this year's market rise of 6.8% year-to-date to end-July 2013. By our calculations, only the stocks shown in green are trading at a discount to fair value.
So we see that most stocks which began 2013 on high ratings have just become even more expensive, and pushed the market further, repeating the pattern of the last few years. This can be measured by the valuation differences between the cheaper and more expensive shares in the market: the valuation dispersions.
Figure 3 shows the dispersion of valuations between stocks in South Africa. The black line represents the lowest CAPE ratio of the 20% most expensively priced stocks on the JSE or the most expensive fifth of the market (Quintile 5). The green line represents the highest CAPE ratio of the 20% most attractively priced stocks on the JSE or the cheapest fifth of the market (Quintile 1). The remainder of the market - 60% of shares - lies between the two lines, in terms of valuation.
What it shows is that in absolute terms, Quintile 5 is looking very very expensive, but over the last few years, these stocks have been getting increasingly expensive relative to the rest of the market. This relative valuation gap between the two lines has risen nearly 50% since 2008, resulting in the longest outperformance for "growth style" investing we have seen in SA (compared to "value style"), as the valuations of expensive stocks continue to get much more expensive relative to low CAPE ratio stocks.
At this point one might expect that we advocate the avoidance of equities, but you'd be interested to know that this is not the case.
The market's long-run average CAPE ratio is 16X, and the current rating is 15.6X, which says at the overall level, the market is about fair value and the asset class (South African equities) as a whole can be owned. But the implication is, that relative to fair value, the range of valuations is becoming even more stretched and investors should be alarmed at WHICH equities they own, if indeed they own the overpriced growth shares. This is the tyranny of averages: this aggregate is comprised of very expensive stocks, as well as stocks that are very attractively priced.
We believe that the multiples on these expensive stocks are not sustainable - they need to maintain very high levels of earnings growth to justify such valuations. With company earnings disappointments will come the risk of investor selloffs and thus investment risk.
One interesting aside to the above is that whilst the price action of these stocks has pushed the JSE to new highs, they have also masked some of the tremendous value opportunities that are available in other areas of the market at the moment.